Overslaan en naar de inhoud gaan
Home

Hoofdnavigatie

  • Home
  • Wiskunde is overal
Geef de woorden op waarnaar u wilt zoeken.
  1. Home
  2. For business economics
  3. Chapter 1: Functions of one variable
  4. Power functions and polynomial functions
  5. Quadratic functions
  6. Extra explanation: graph

Extra explanation: graph

Introduction: A function of the form $y(x)=ax^2+bx+c$, where $a$, $b$ and $c$ are numbers ($a\neq 0$) is called a quadratic function.

Graph: The graph of a quadratic function is a parabola; if $a>0$ the parabola is opened upward and if $a<0$ opened downward.

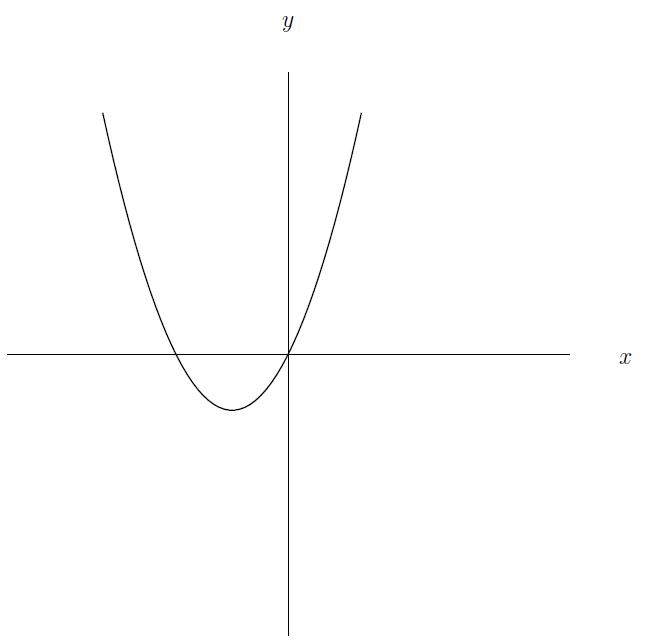
Hence, a quadratic function $y(x)=ax^2+bx+c$ with $a>0$ looks as follows.


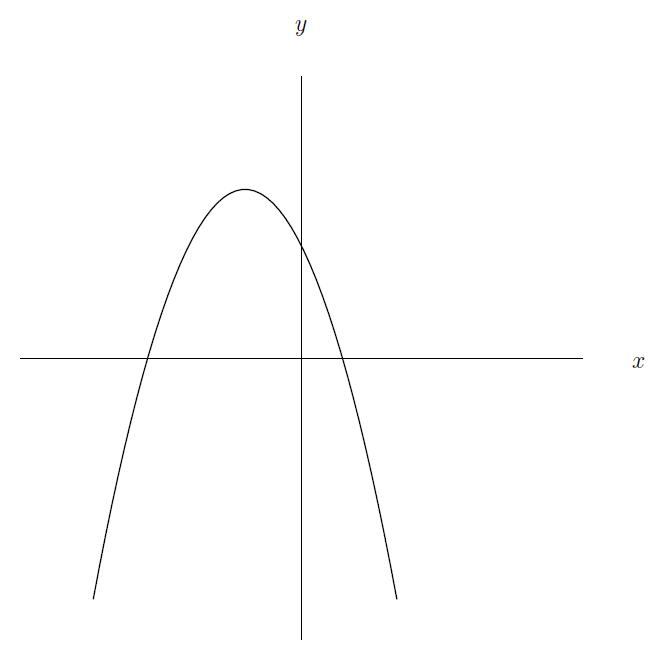
And a quadratic function $y(x)=ax^2+bx+c$ with $a<0$ looks as follows.

‹ Vorige paginaQuadratic functions
Volgende paginaExercise 1 ›
Wiskunde Mathematics for business economics leeromgeving


  • Chapter 1: Functions of one variable
    • Definitions
    • Power functions and polynomial functions
      • Constant functions
      • Linear functions
      • Quadratic functions
        • Extra explanation: graph
        • Exercise 1
        • Extra explanation: zeros
        • Example 1
        • Exercise 2
        • Exercise 3
        • Extra explanation: solving inequality
        • Example 2 (film)
        • Exercise 4
        • Exercise 5
        • Example 3 (film)
        • Exercise 6
        • Exercise 7
        • Exercise 8
        • Exercise 9
        • Exercise 10
        • Exercise 11
        • Exercise 12
      • Positive integer power functions
      • Polynomial functions
      • Negative integer power functions
      • Power functions
      • Properties power functions
    • Exponential and logarithmic functions
    • Applications
  • Chapter 2: Differentiation of functions of one variable
  • Chapter 3: Functions of two variables
  • Chapter 4: Differentiation of functions of two variables
  • Chapter 5: Optimization
  • Chapter 6: Areas and integrals

Footer-menu

  • Cookiebeleid en privacy
  • Disclaimer
Wiskunde D leeromgeving